> For the complete documentation index, see [llms.txt](https://help.stockcharts.com/llms.txt). Markdown versions of documentation pages are available by appending `.md` to page URLs; this page is available as [Markdown](https://help.stockcharts.com/charts-and-tools/stockchartsacp/stockchartsacp-plug-ins.md).
# StockChartsACP Plug-Ins
Plug-ins extend the functionality of StockChartsACP, allowing you to add specialized indicators and other features to the platform.
We recommend installing the free StockCharts **Advanced Indicator Pack**. This pack features indicators for StockChartsACP that are unavailable elsewhere on the StockCharts site, including Balance of Power, DEMA, and TTM Squeeze. We'll use this indicator pack as an example in the section below on installing free plug-ins.
StockCharts has also partnered with technical analysis experts to bring you many additional plug-ins. Free and paid plug-ins are available, and more are being added constantly. Please see the ACP Plug-Ins page in the StockCharts Marketplace for a complete list of plug-ins currently available and a sneak peek at new plug-ins coming soon.
## Installing StockChartsACP Plug-Ins
To add a StockChartsACP plug-in to your account, click the **Plug-In icon** on the Platform Integrations menu at the bottom right. This opens a panel showing many of the available plug-ins. Click the “Get the Plug-In” button for more information on a specific plug-in, or click the “See All Plug-Ins” button at the bottom for a complete list.
StockChartsACP Plug-Ins
When you click on a link, you'll enter the StockCharts Marketplace, where you can purchase and install plug-ins.
{% hint style="warning" %}
**Note:** Log in to your StockCharts account before installing plug-ins.
{% endhint %}
***
## Installing Free Plug-Ins
From the StockCharts Marketplace page, if you want to install the free plug-in, click the green **Install Now** button.
Installing a free Plug-In in StockChartsACP.
You will see a popup message indicating the plug-in has been successfully installed to your StockCharts account.
To return to StockChartsACP and begin using the new plug-in, click the **Launch ACP** button.
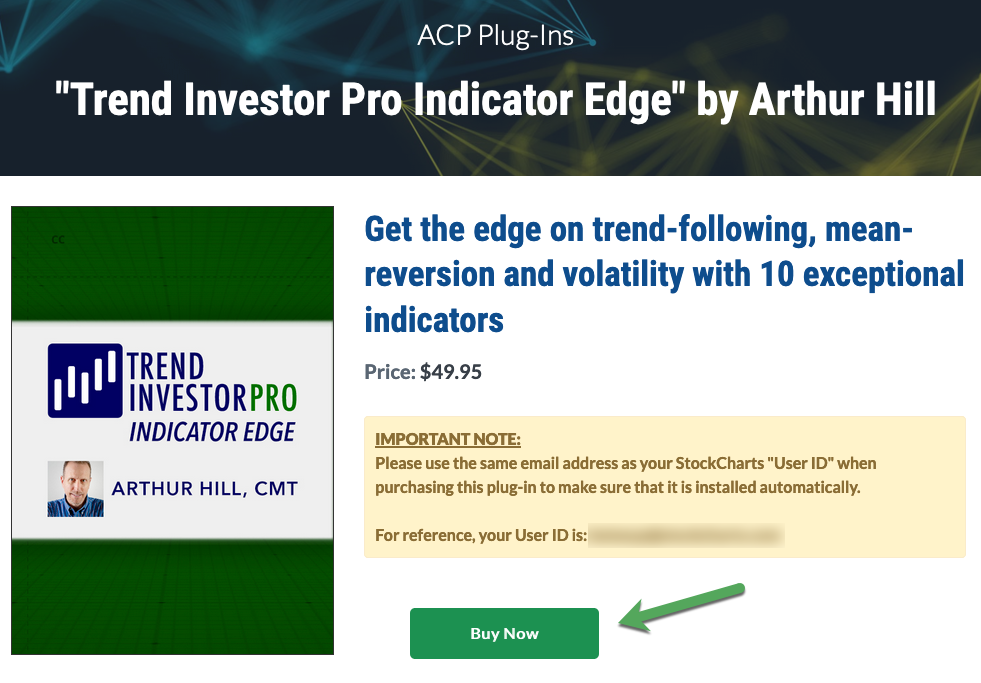
## Installing Paid Plug-Ins
Click the green **Buy Now** button from the StockCharts Marketplace page for the paid plug-in you'd like to purchase and install.
A popup window will open where you can enter your contact and payment information.
{% hint style="warning" %}
**Note:** Enter the same email address you use to log in to your StockCharts account.
{% endhint %}
You can request a full refund within 10 days of purchasing a paid ACP plug-in. **After 10 days, the plug-ins are no longer refundable.**
Once the payment process is complete, return to StockChartsACP to begin using your new plug-in.
## Using Plug-Ins in StockChartsACP
Your new plug-in functionality will be available immediately in StockChartsACP.
For indicator-based plug-ins, the indicators associated with that plug-in will be available on the **Chart Settings panel**, listed below the Add Indicators section. When you collapse the Standard Indicators section by clicking on the minus sign, you will see all the indicators associated with the new plug-in.
StockChartsACP Plug-in indicator list
## Help for Specific StockChartsACP Plug-Ins
Some of our plug-in authors offer additional documentation for their plug-ins, including instructions for using their plug-in functionality and information about the indicators included. The list below shows plug-ins that have additional documentation available at this time. Please see the StockCharts Marketplace for a [complete list of available ACP Plug-Ins](https://stockcharts.com/marketplace/acp/).
***
### GoNoGo Charts Starter Pack and Plug-In
GoNoGo Charts' tools use a combination of technical analysis and statistical measures to help investors understand the direction and continuity of price trends for any security and any asset class, across any timeframe. The free GoNoGo Starter Pack introduces members to GoNoGo Charts with a custom GoNoGo chart type and accompanying ChartStyle; the full GoNoGo Charts Plug-In offers more in-depth tools.
[**Install Starter Pack**](https://stockcharts.com/marketplace/acp/gonogo-starter.html) | [**Buy This Plug-In**](https://stockcharts.com/marketplace/acp/gonogo-charts.html) | [**Read Plug-In Documentation**](/charts-and-tools/stockchartsacp/stockchartsacp-plug-ins/gonogo-charts-plug-in.md)
***
### Larry Williams Stock Trading Starter Pack
This plug-in from Larry Williams features six unique stock trading tools developed by Larry Williams - the same indicators he uses in his own trading. Each indicator serves a specific and separate purpose; together, these tools can help you find winning trades and set entry/exit points.
[**Buy This Plug-In**](https://stockcharts.com/marketplace/acp/larry-williams.html) | [**Read Plug-In Documentation**](/charts-and-tools/stockchartsacp/stockchartsacp-plug-ins/larry-williams-stock-trading-starter-pack-plug-in.md)
***
### MarketGauge Opening Range Indicators
The Opening Range (OR) trading approach views the high and low of a period to help view trades in terms of risk/reward parameters. The two main objectives of the OR indicator are to:
* Identify key price points in the market where market sentiment is likely to lead to a change in the stock’s short-term direction
* Identify key price points where market sentiment will likely accelerate its current momentum.
[**Buy This Plug-In**](https://stockcharts.com/marketplace/acp/marketgauge-opening-range.html) | [**Read Plug-In Documentation**](/charts-and-tools/stockchartsacp/stockchartsacp-plug-ins/marketgauge-plug-ins.md#opening_range_indicators)
***
### MarketGauge Real Motion Indicators
This plug-in from MarketGauge enables you to see the trends, support, and resistance in momentum, which influence price trends. Typically used with the MarketGauge Triple Play Indicators plug-in to get a total picture of a security's performance, the Real Motion plug-in provides the momentum component of that total picture.
[**Buy This Plug-In**](https://stockcharts.com/marketplace/acp/marketgauge-realmotion.html) | [**Read Plug-In Documentation**](/charts-and-tools/stockchartsacp/stockchartsacp-plug-ins/marketgauge-plug-ins.md#real_motion_plug-in)
***
### MarketGauge Triple Play Indicators
This plug-in from MarketGauge allows you to quickly and easily identify trends with supporting volume. Typically used with the MarketGauge Real Motion plug-in to get a total picture of a security's performance, the indicators in this plugin focus on volume and price trends.
[**Buy This Plug-In**](https://stockcharts.com/marketplace/acp/marketgauge-price-performance.html) | [**Read Plug-In Documentation**](/charts-and-tools/stockchartsacp/stockchartsacp-plug-ins/marketgauge-plug-ins.md#triple_play_plug-in)
***
### Simpler Trading Moxie Indicator
This plug-in from Simpler Trading gives you access to four components of the Moxie IndicatorTM developed by TG Watkins. This suite of energy/momentum indicator tools allow you to analyze stocks in multiple timeframes and identify big moves before they happen.
[**Buy This Plug-In**](https://stockcharts.com/marketplace/acp/simpler-trading-moxie.html) | [**Read Plug-In Documentation**](/charts-and-tools/stockchartsacp/stockchartsacp-plug-ins/simpler-trading-moxie-indicator-plug-in.md)
***
### Trading Simplified by Dave Landry
This plug-in from Dave Landry features six powerful but easy-to-use indicators that will help both new and seasoned traders stay on the right side of the trend and keep their investing on track. These simple indicators have been used by Dave Landry in his own trading for years, and many are used as part of his 10% TFM (“Trend Following Moron”) trading system.
[**Buy This Plug-In**](https://stockcharts.com/marketplace/acp/trading-simplified.html) | [**Read Plug-In Documentation**](/charts-and-tools/stockchartsacp/stockchartsacp-plug-ins/trading-simplified-by-dave-landry.md)
***
### Trend Investor Pro Indicator Edge
This plug-in from Arthur Hill is designed to help you trade in the direction of the bigger trend. Define the trend and spot new trends using the unique five-indicator Trend Composite. Identify pullbacks and mean-reversion opportunities using the fully-customizable Momentum Composite. This plug-in also includes normalized volatility, normalized rate-of-change and some classic indicators with a distinctive twist.
[**Buy This Plug-In**](https://stockcharts.com/marketplace/acp/trend-investor-pro.html) | [**Read Plug-In Documentation**](/charts-and-tools/stockchartsacp/stockchartsacp-plug-ins/trend-investor-pro-indicator-edge.md)
---
# Agent Instructions
This documentation is published with GitBook. GitBook is the documentation platform designed so that both humans and AI agents can read, navigate, and reason over technical content effectively. Learn more at gitbook.com.
## Querying This Documentation
If you need additional information that is not directly available in this page, you can query the documentation dynamically by asking a question.
Perform an HTTP GET request on the current page URL with the `ask` query parameter, and the optional `goal` query parameter:
```
GET https://help.stockcharts.com/charts-and-tools/stockchartsacp/stockchartsacp-plug-ins.md?ask=&goal=
```
`ask` is the immediate question: it should be specific, self-contained, and written in natural language.
`goal` is optional and describes the broader end goal you are ultimately trying to accomplish on behalf of the user. GitBook uses it to tailor the answer towards what is most useful for that goal.
The response will contain a direct answer to the question and relevant excerpts and sources from the documentation.
Use this mechanism when the answer is not explicitly present in the current page, you need clarification or additional context, or you want to retrieve related documentation sections.